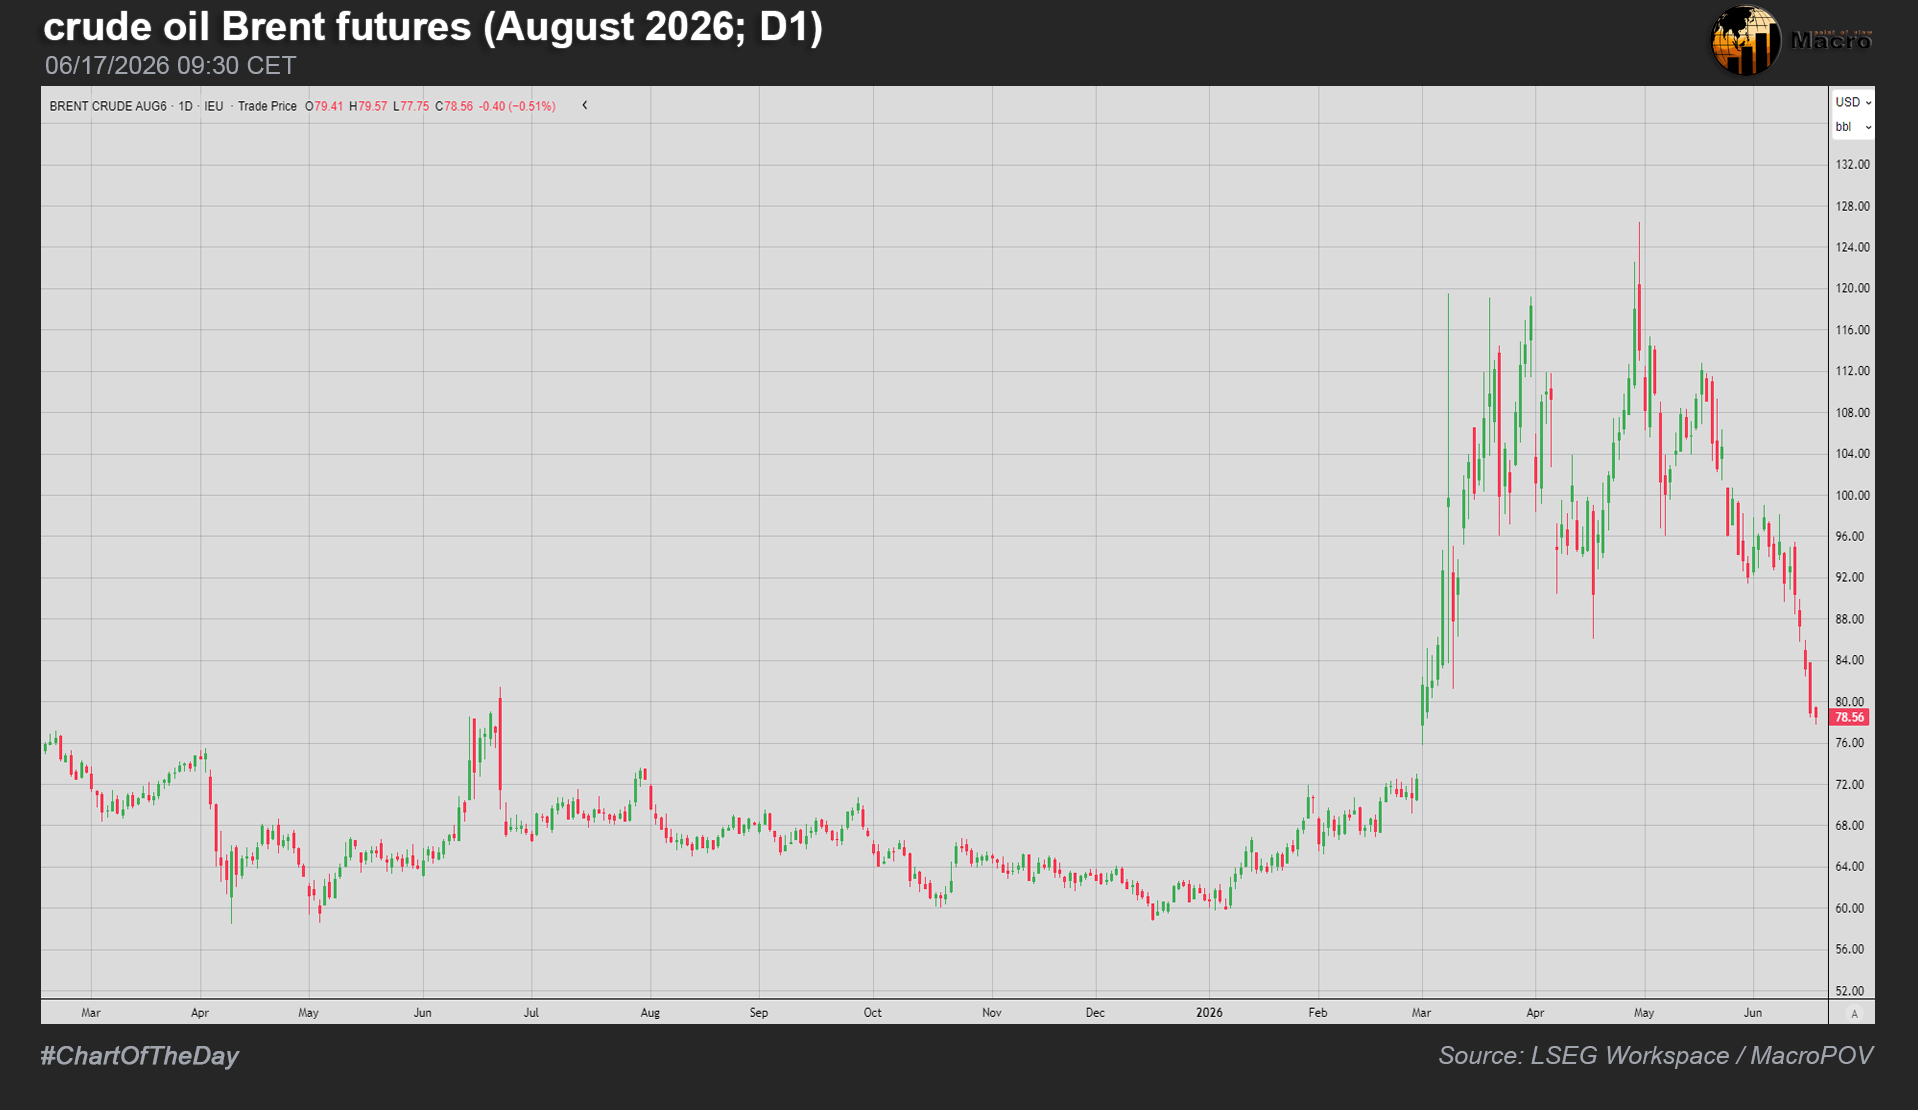
The $72 Oil Illusion #ChartOfTheDay
Peace in the Middle East looks closer right now than at any point since this war started on February 28.
You can see it on the chart: Brent is correcting hard, and on this daily chart it looks like it’s lining up to close the gap that opened back in March 2026, sliding toward pre-war levels under $72/bbl.
I’d be careful chasing it down there, though. Inventories have been drawn down hard during the conflict; the US just signaled a 200-million-barrel rebuild of the Strategic Petroleum Reserve by 2027—that’s about 200% of global daily demand(!) and we still don’t have a real picture of how much damage was done to oil and export infrastructure across the Gulf. This move down might be pricing in a cleaner ending than what’s actually on the ground.
What are your expectations for oil prices over the coming sessions?